> ## Documentation Index
> Fetch the complete documentation index at: https://lightdash-docs-many-to-many.mintlify.site/llms.txt
> Use this file to discover all available pages before exploring further.
# Querying tables
> Now that you've connected your dbt project to Lightdash, it's time to start exploring your data.
A **Table** is the main starting point for exploring data in Lightdash. It contains a group of related dbt models, dimensions, and metrics. You **explore Tables in the Explore view**.
## An intro to Tables and the Explore view
[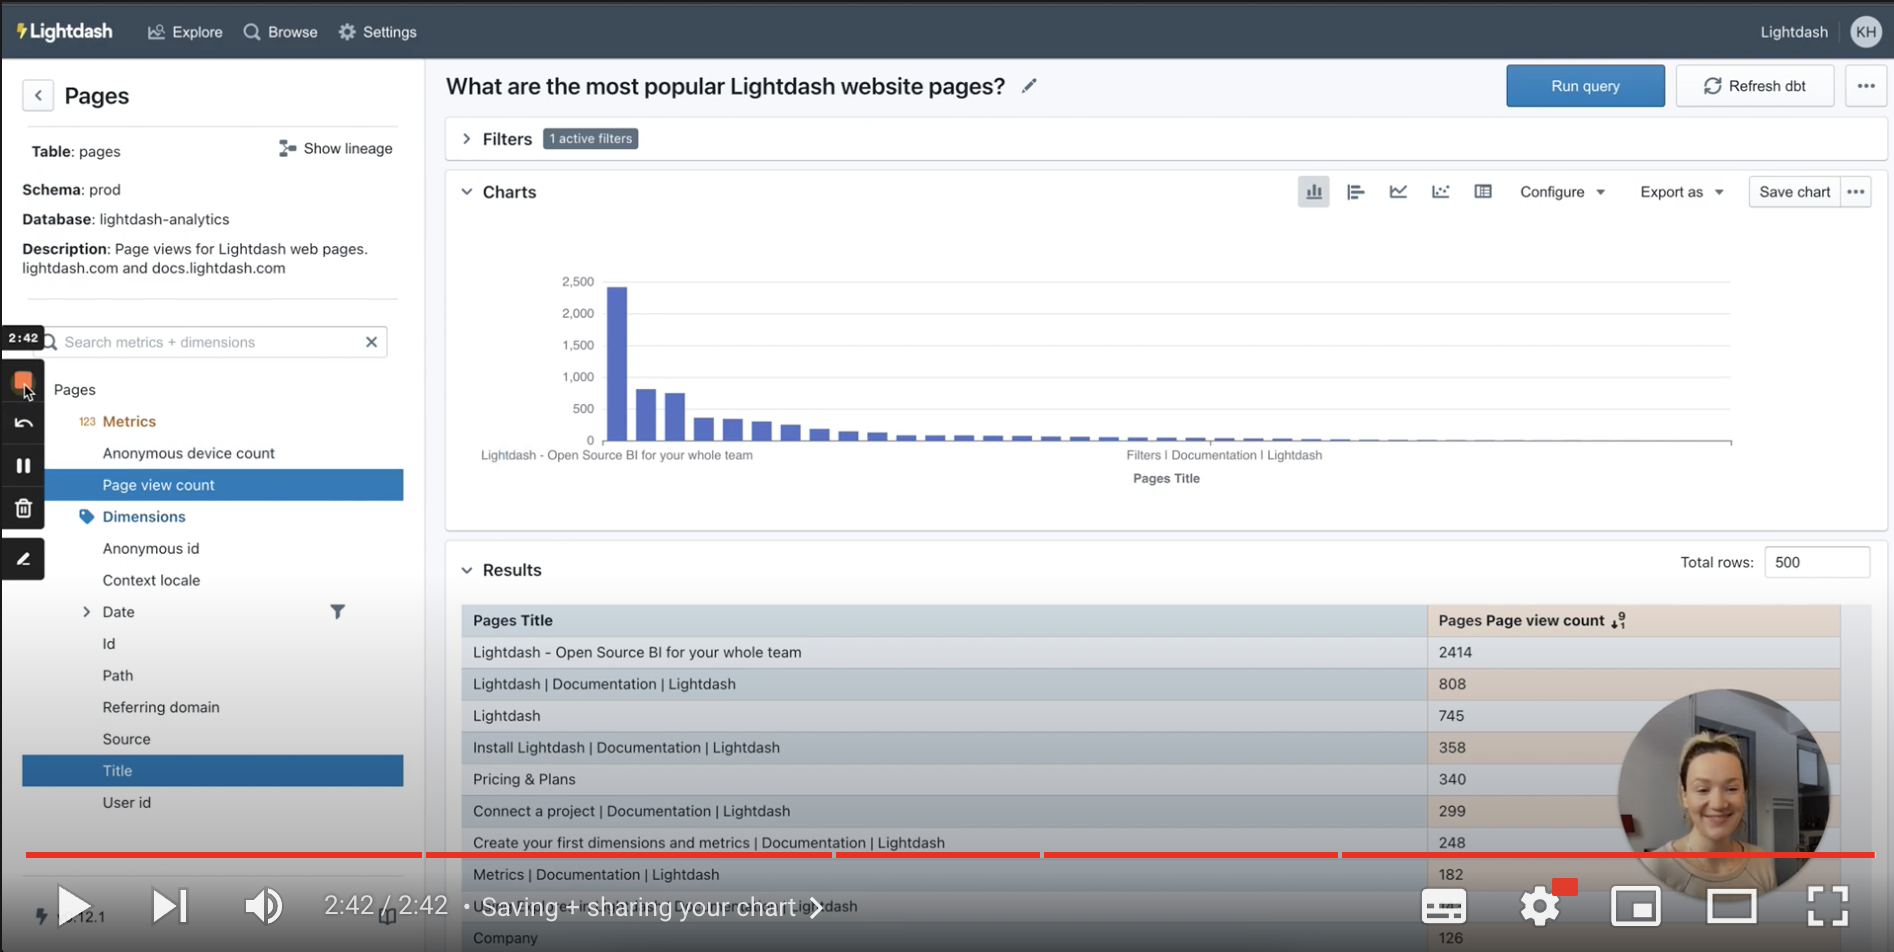](https://youtu.be/2pQYuIT0674)
### There are 5 areas to the Explore view
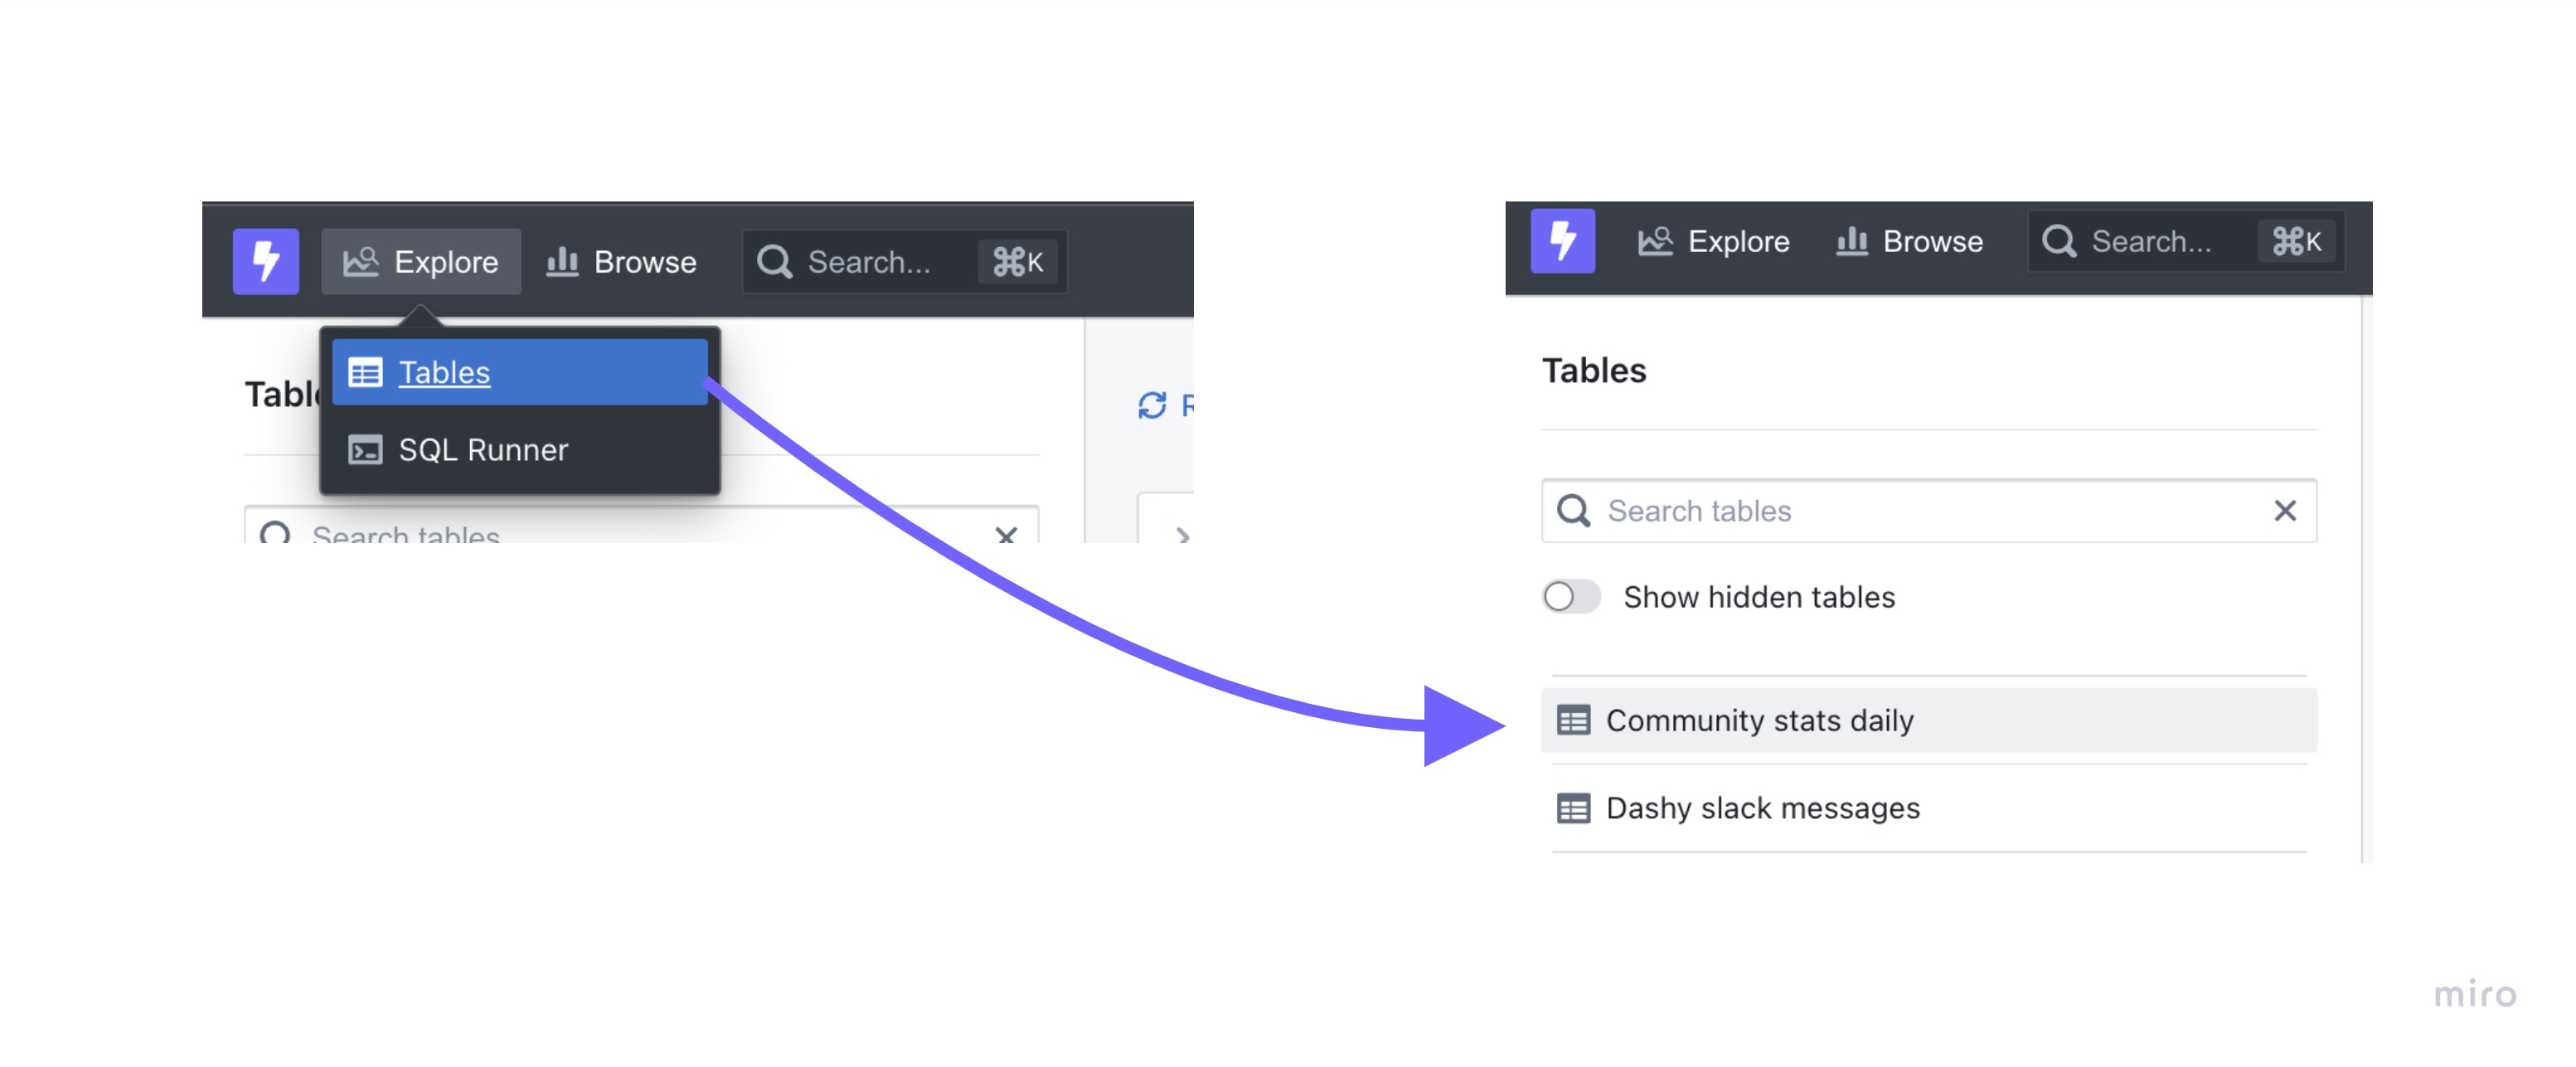
To access the Explore view, you just need to go to `Explore` --> `Tables` -> then select the Table you want to explore.
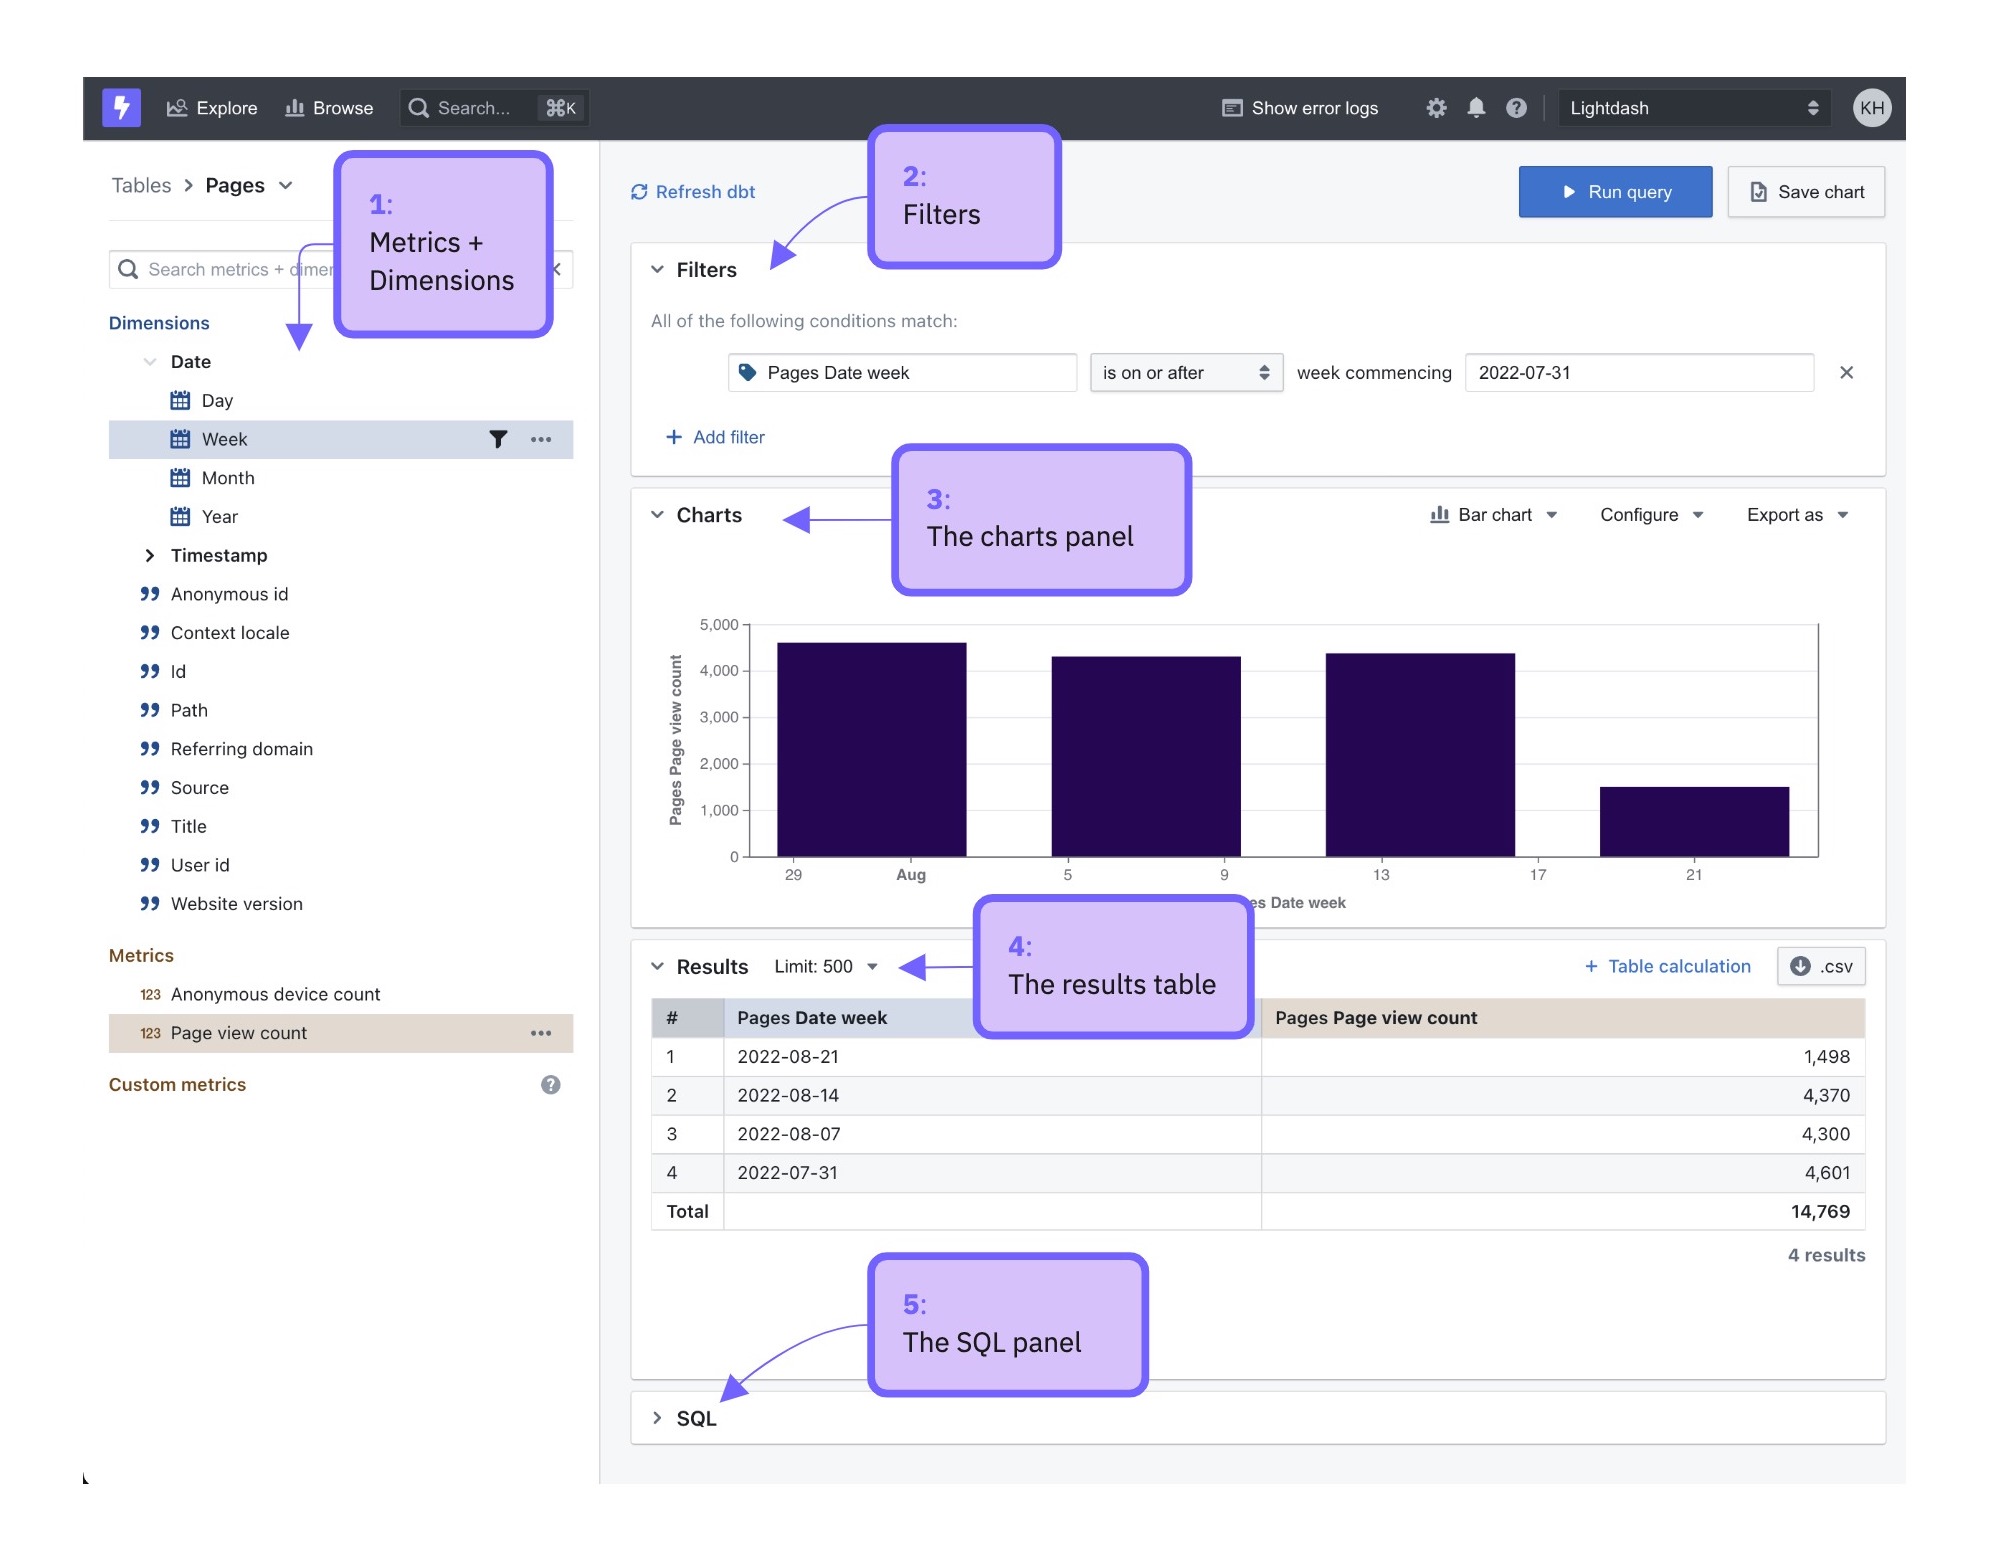
 The Explore view is really made up of 5 areas:
1. The list of metrics and dimensions available on the Table
2. The filters panel, which lets you restrict the data pulled into Lightdash
3. The chart panel to visualise the results of queries
4. The results panel to explore the results of queries as a table
5. The SQL panel, which shows the raw SQL that produced the results
The Explore view is really made up of 5 areas:
1. The list of metrics and dimensions available on the Table
2. The filters panel, which lets you restrict the data pulled into Lightdash
3. The chart panel to visualise the results of queries
4. The results panel to explore the results of queries as a table
5. The SQL panel, which shows the raw SQL that produced the results
 ## How to create a saved chart from the Explore view in 5 easy steps
[](https://youtu.be/1hqRFy-wk98)
### Step 1: Select the Table you want to explore
Go to `Explore` --> `Tables` --> then select the Table that you want to explore.
### Step 2: Run your query
To run a query:
1. Select a metric to calculate
2. Select one or more dimensions to split the metric into groups
3. Hit "Run Query" in the top right
For example, if I wanted to know the "total number of orders split by order status", I'd select the `Unique order count` metric to calculate the number of orders and the `Status` dimension to split that by status.
### Step 3: Order the results in your table
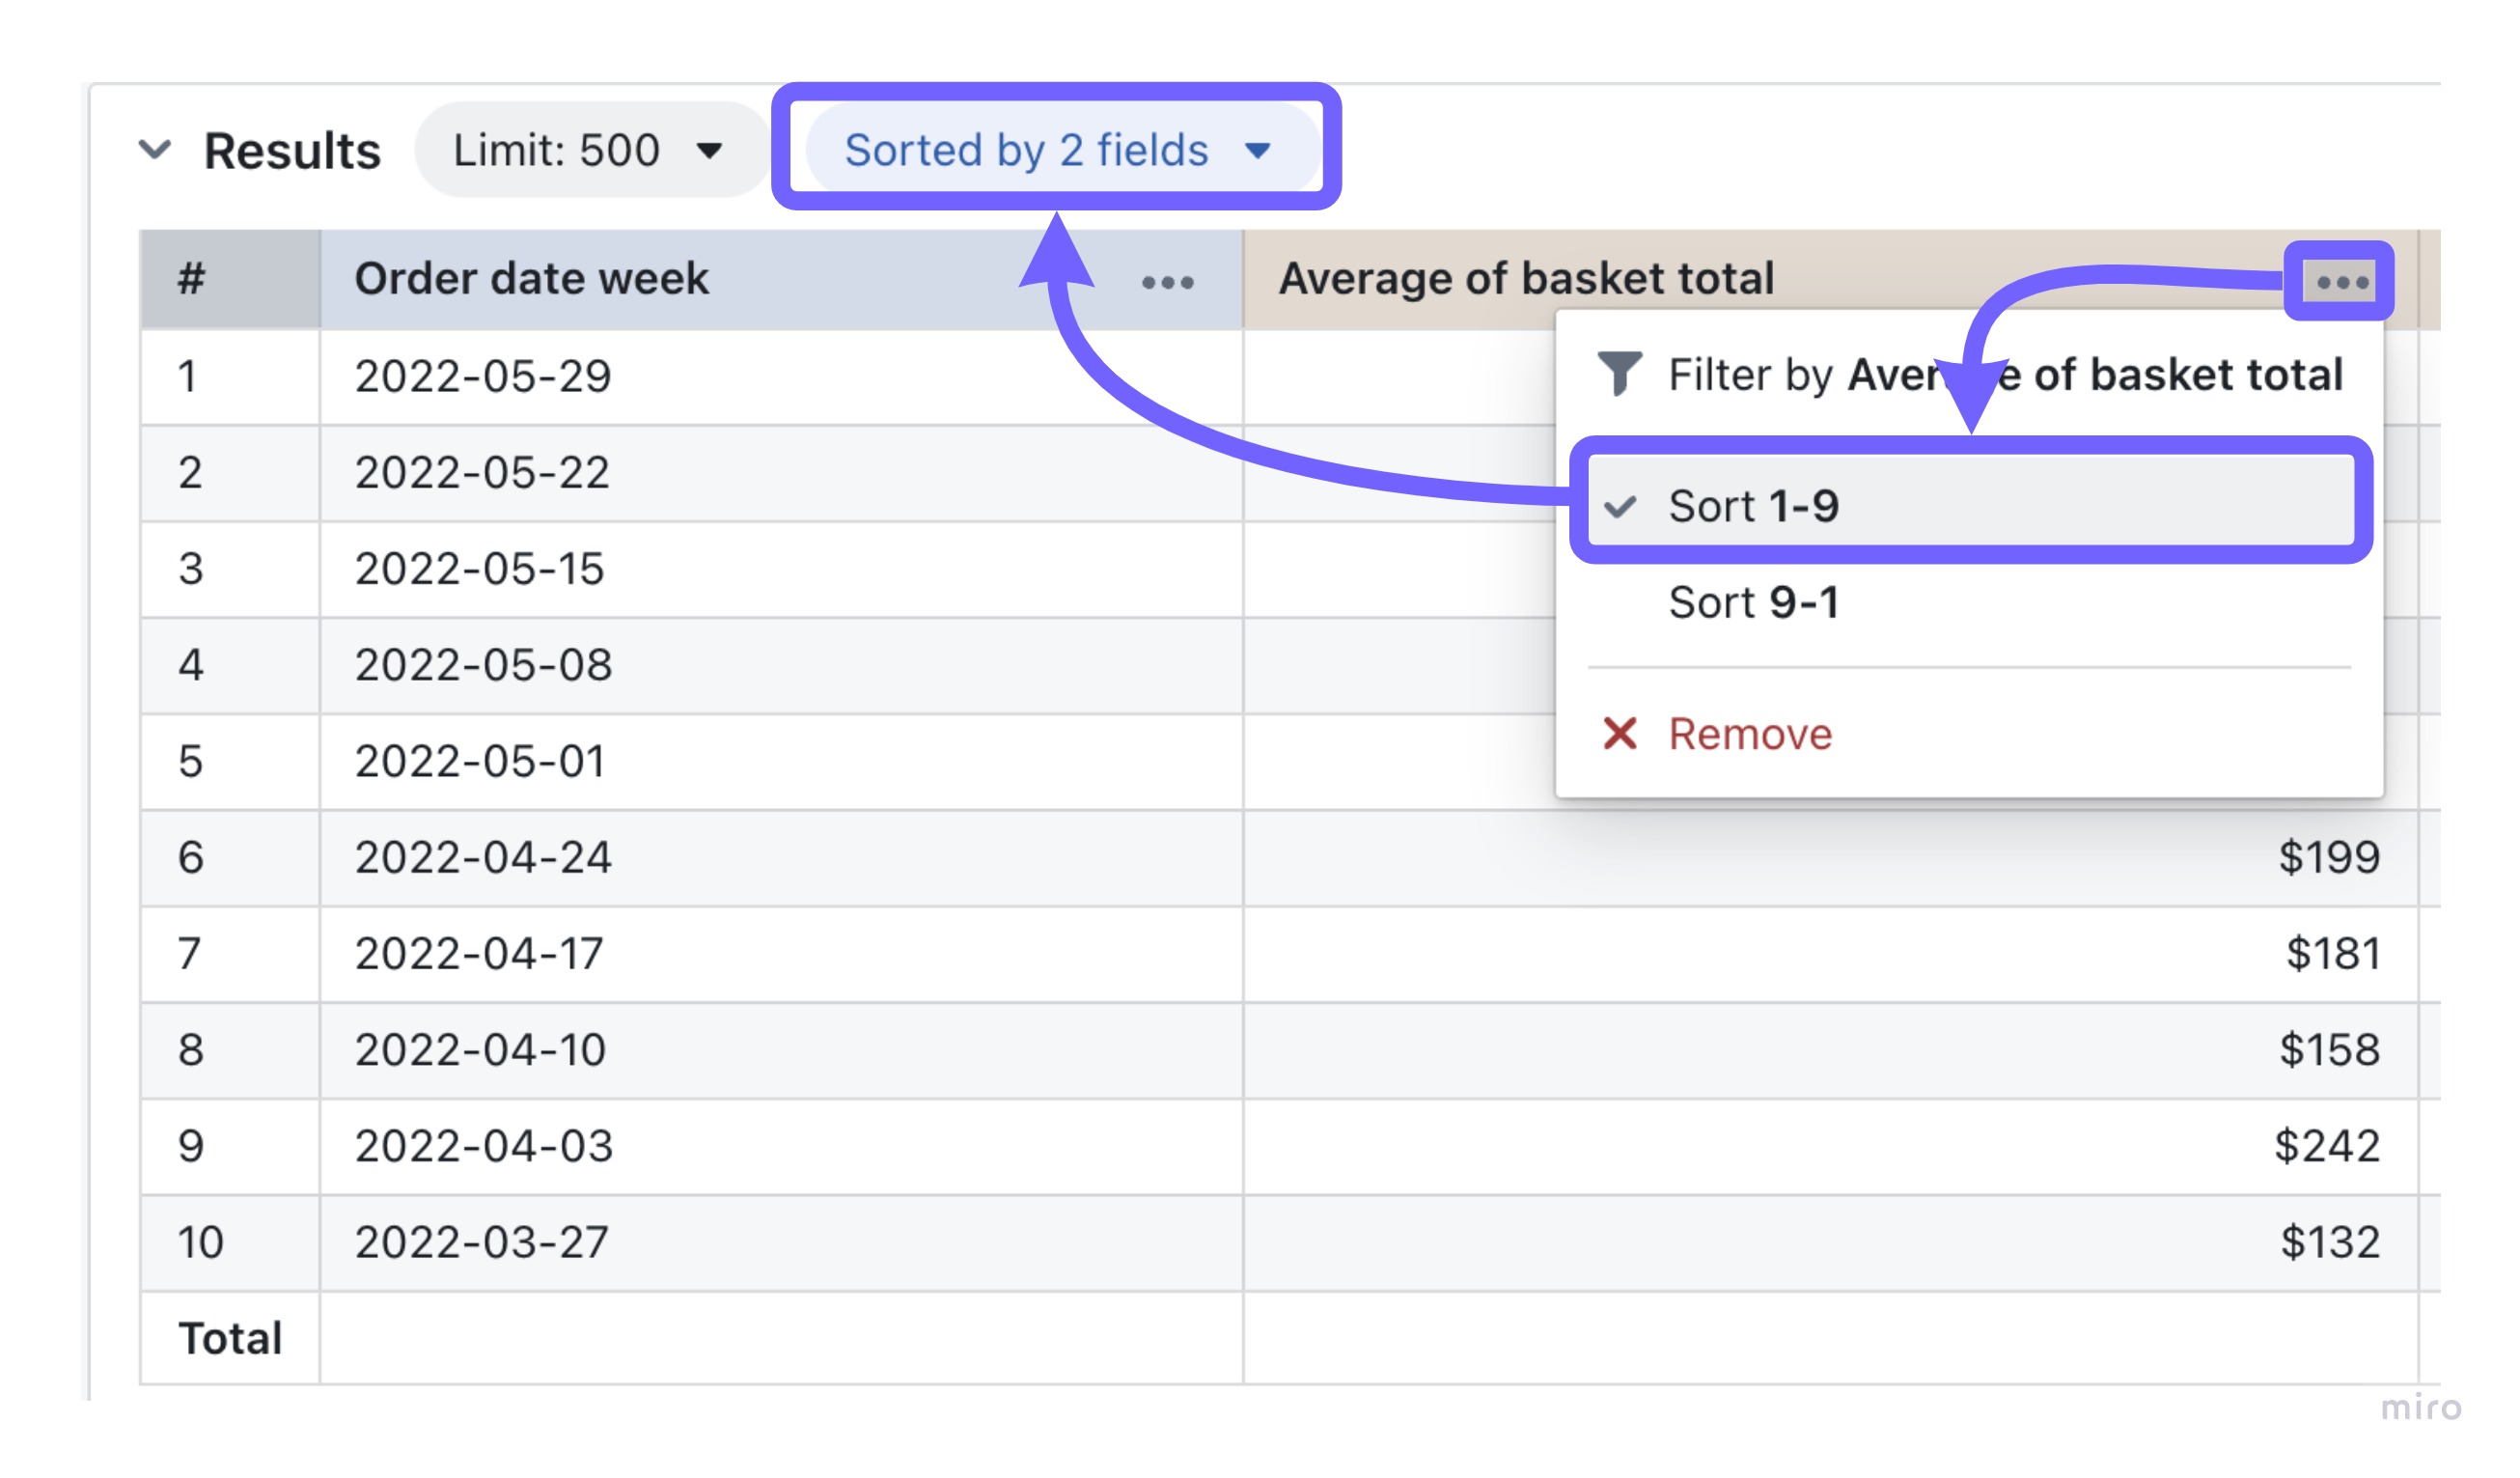
Click on the three-dot-menu by your column headers and select the sorting option that you want for a column.
## How to create a saved chart from the Explore view in 5 easy steps
[](https://youtu.be/1hqRFy-wk98)
### Step 1: Select the Table you want to explore
Go to `Explore` --> `Tables` --> then select the Table that you want to explore.
### Step 2: Run your query
To run a query:
1. Select a metric to calculate
2. Select one or more dimensions to split the metric into groups
3. Hit "Run Query" in the top right
For example, if I wanted to know the "total number of orders split by order status", I'd select the `Unique order count` metric to calculate the number of orders and the `Status` dimension to split that by status.
### Step 3: Order the results in your table
Click on the three-dot-menu by your column headers and select the sorting option that you want for a column.
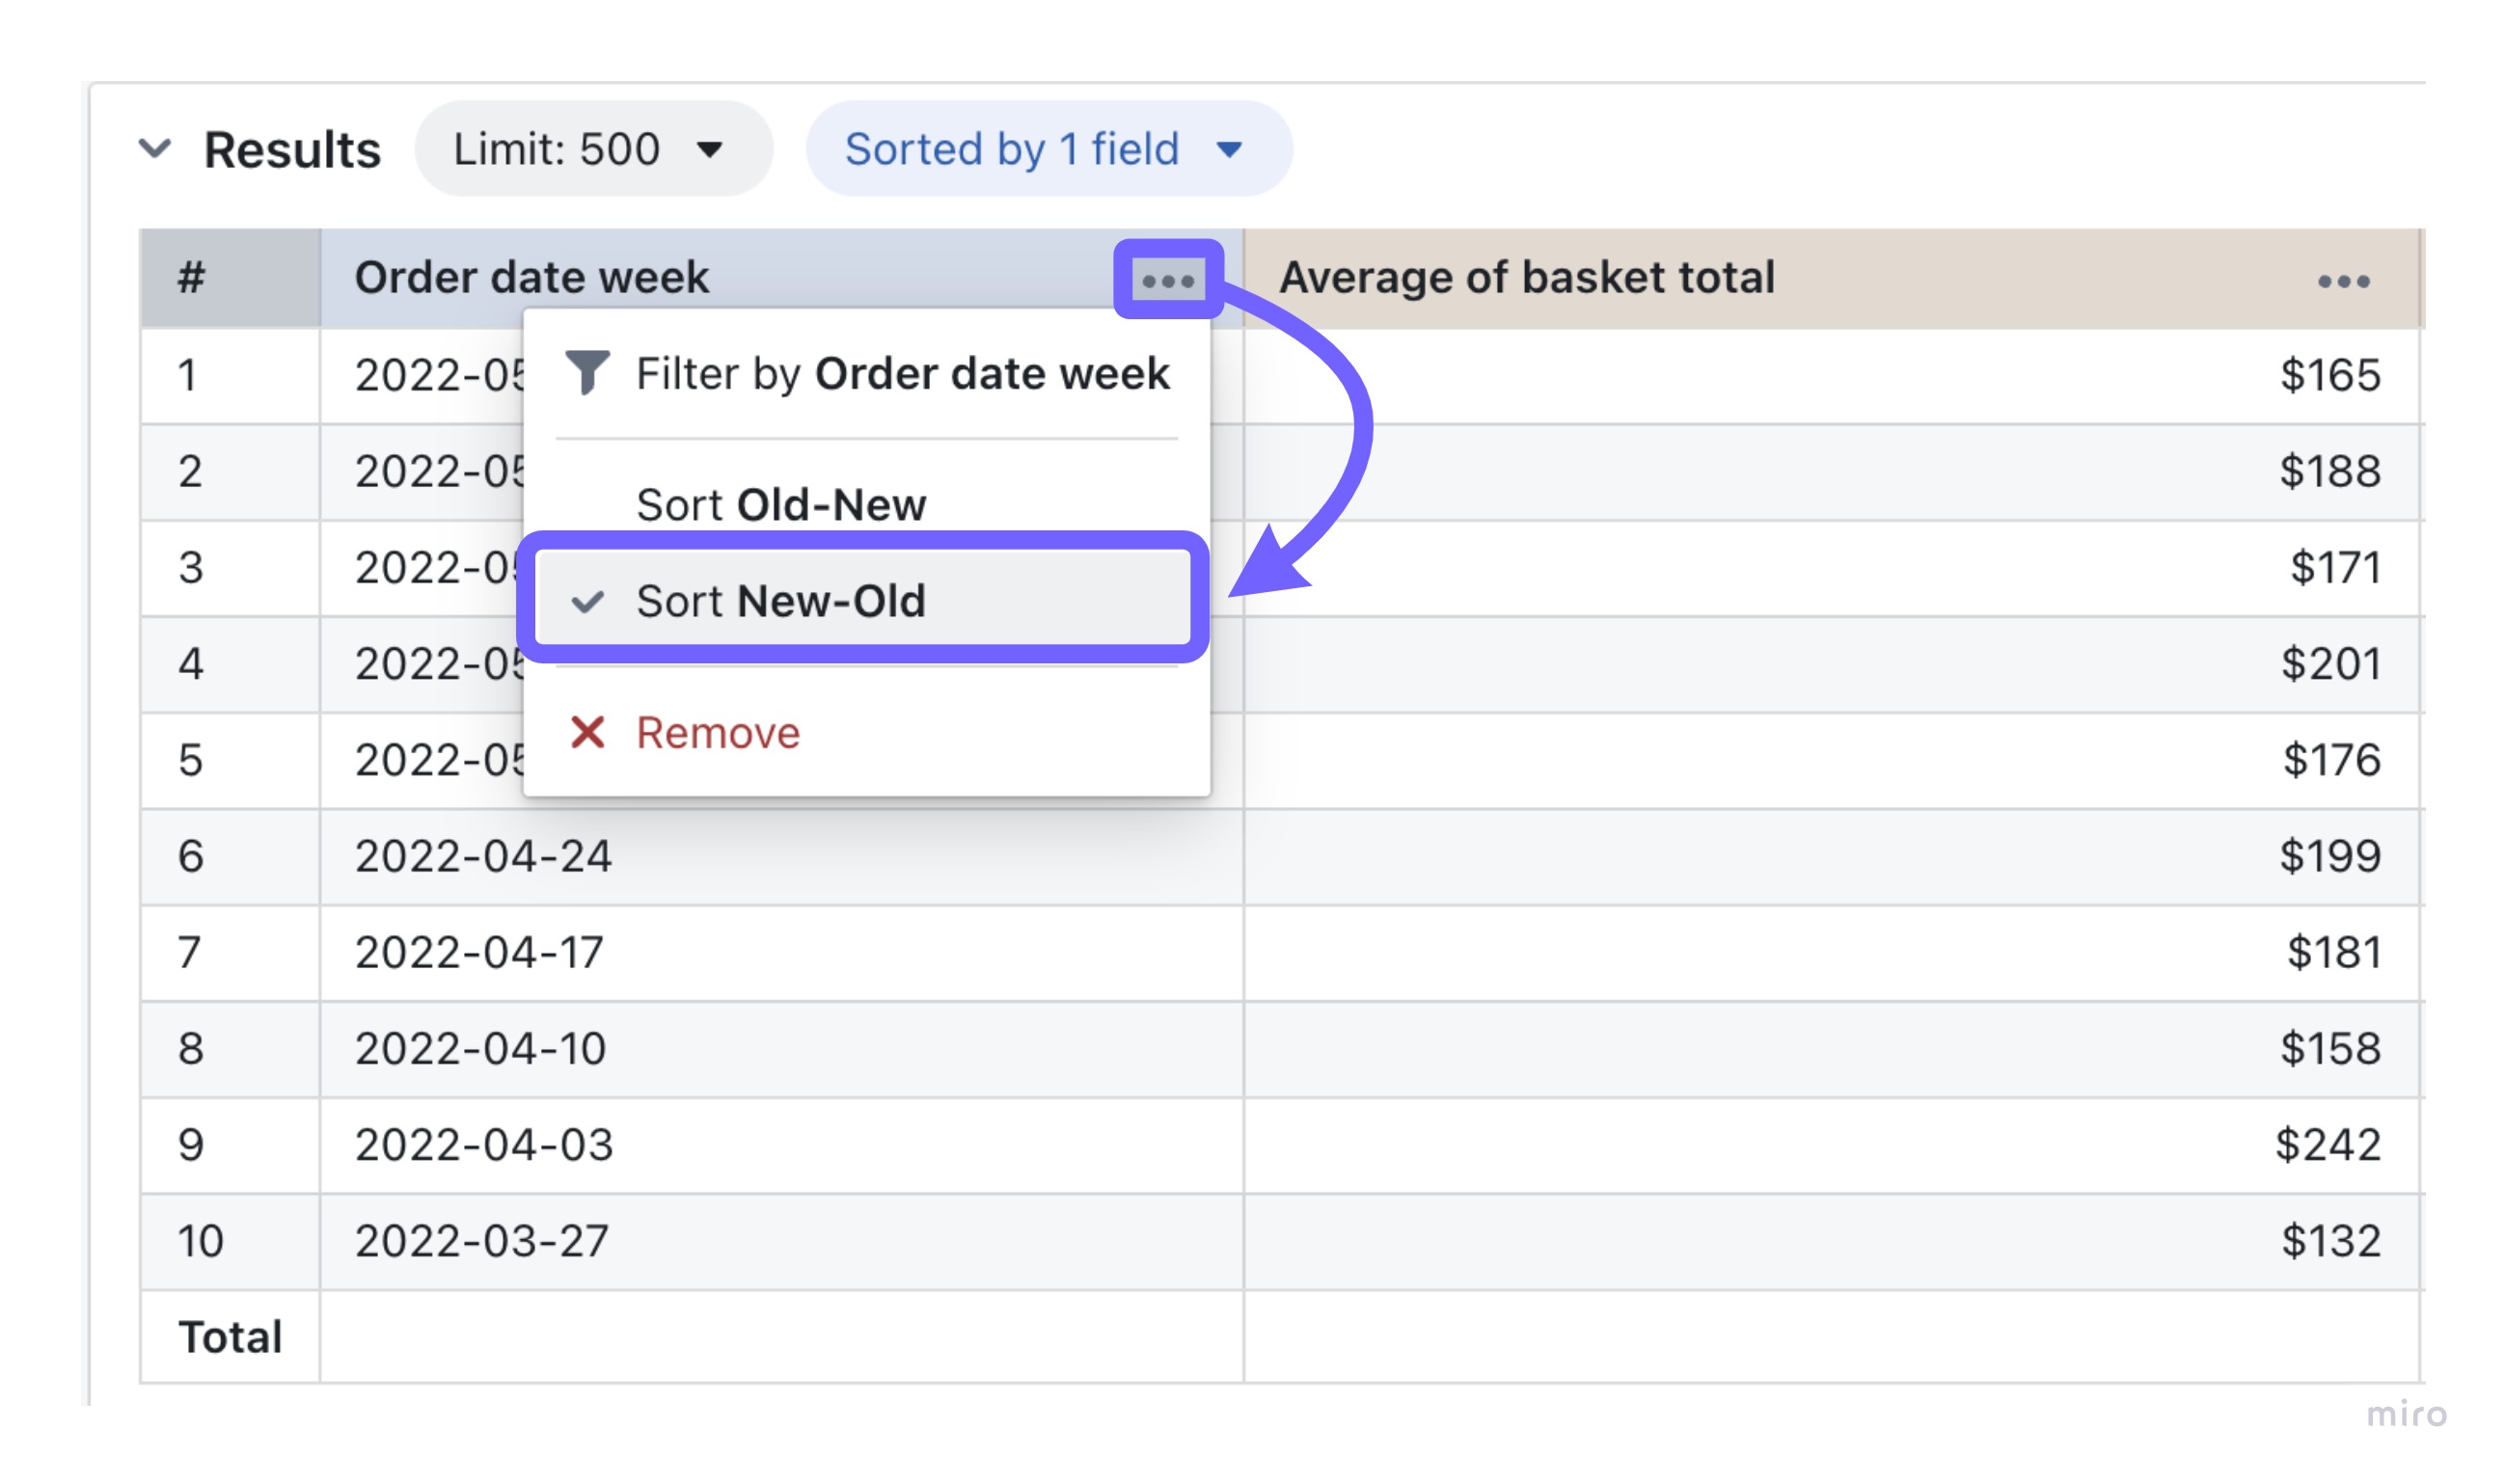 You can have multiple sorts by adding more columns using their three-dot-menu. You can see the number of sorts applied just above your results table.
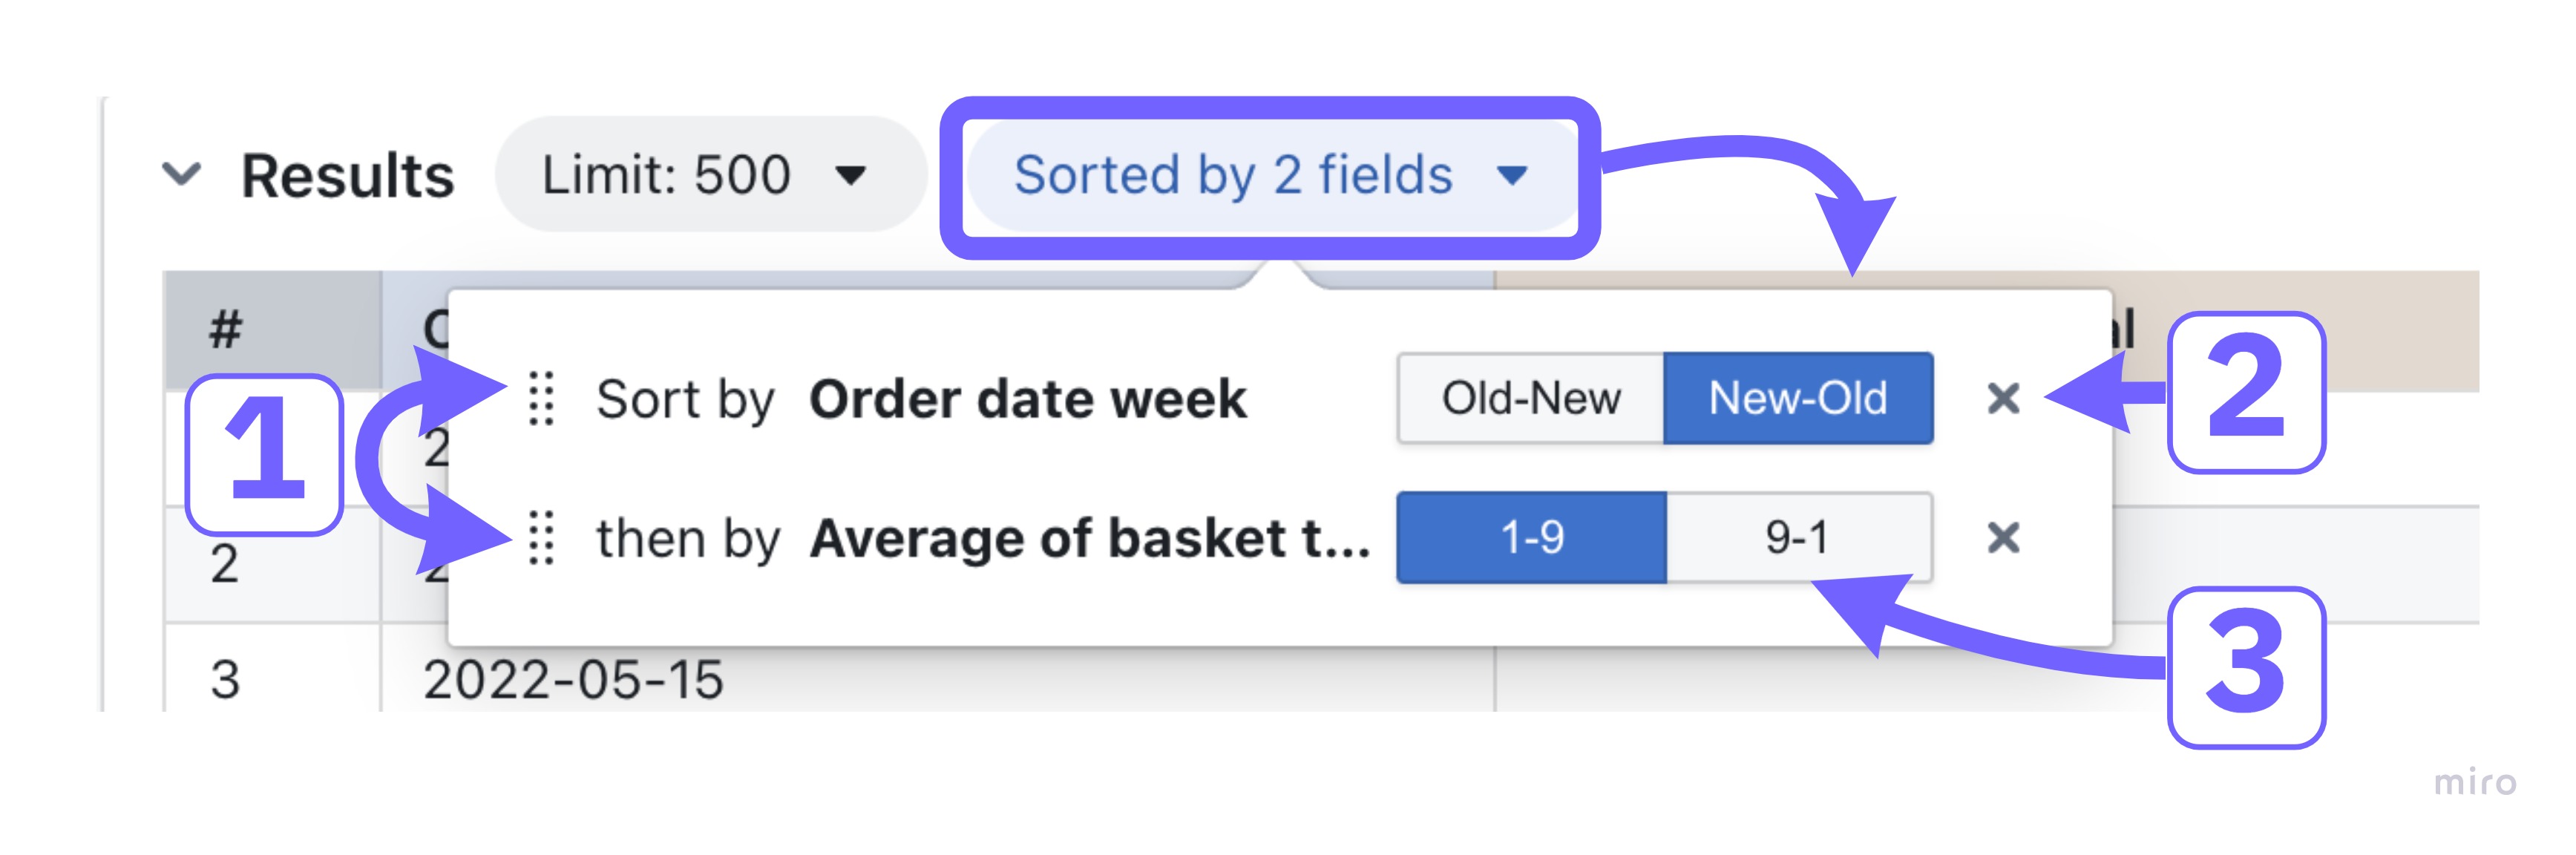
 You can update and change the sorting using of your table by clicking on the `sort` menu. Here, you have the option to:
1. Drag-and-drop columns to rearrange the order of sorting multiple columns.
2. Remove a sort
3. Change the order of a column's sort
You can update and change the sorting using of your table by clicking on the `sort` menu. Here, you have the option to:
1. Drag-and-drop columns to rearrange the order of sorting multiple columns.
2. Remove a sort
3. Change the order of a column's sort
 ### Step 4: Visualize query results as a chart
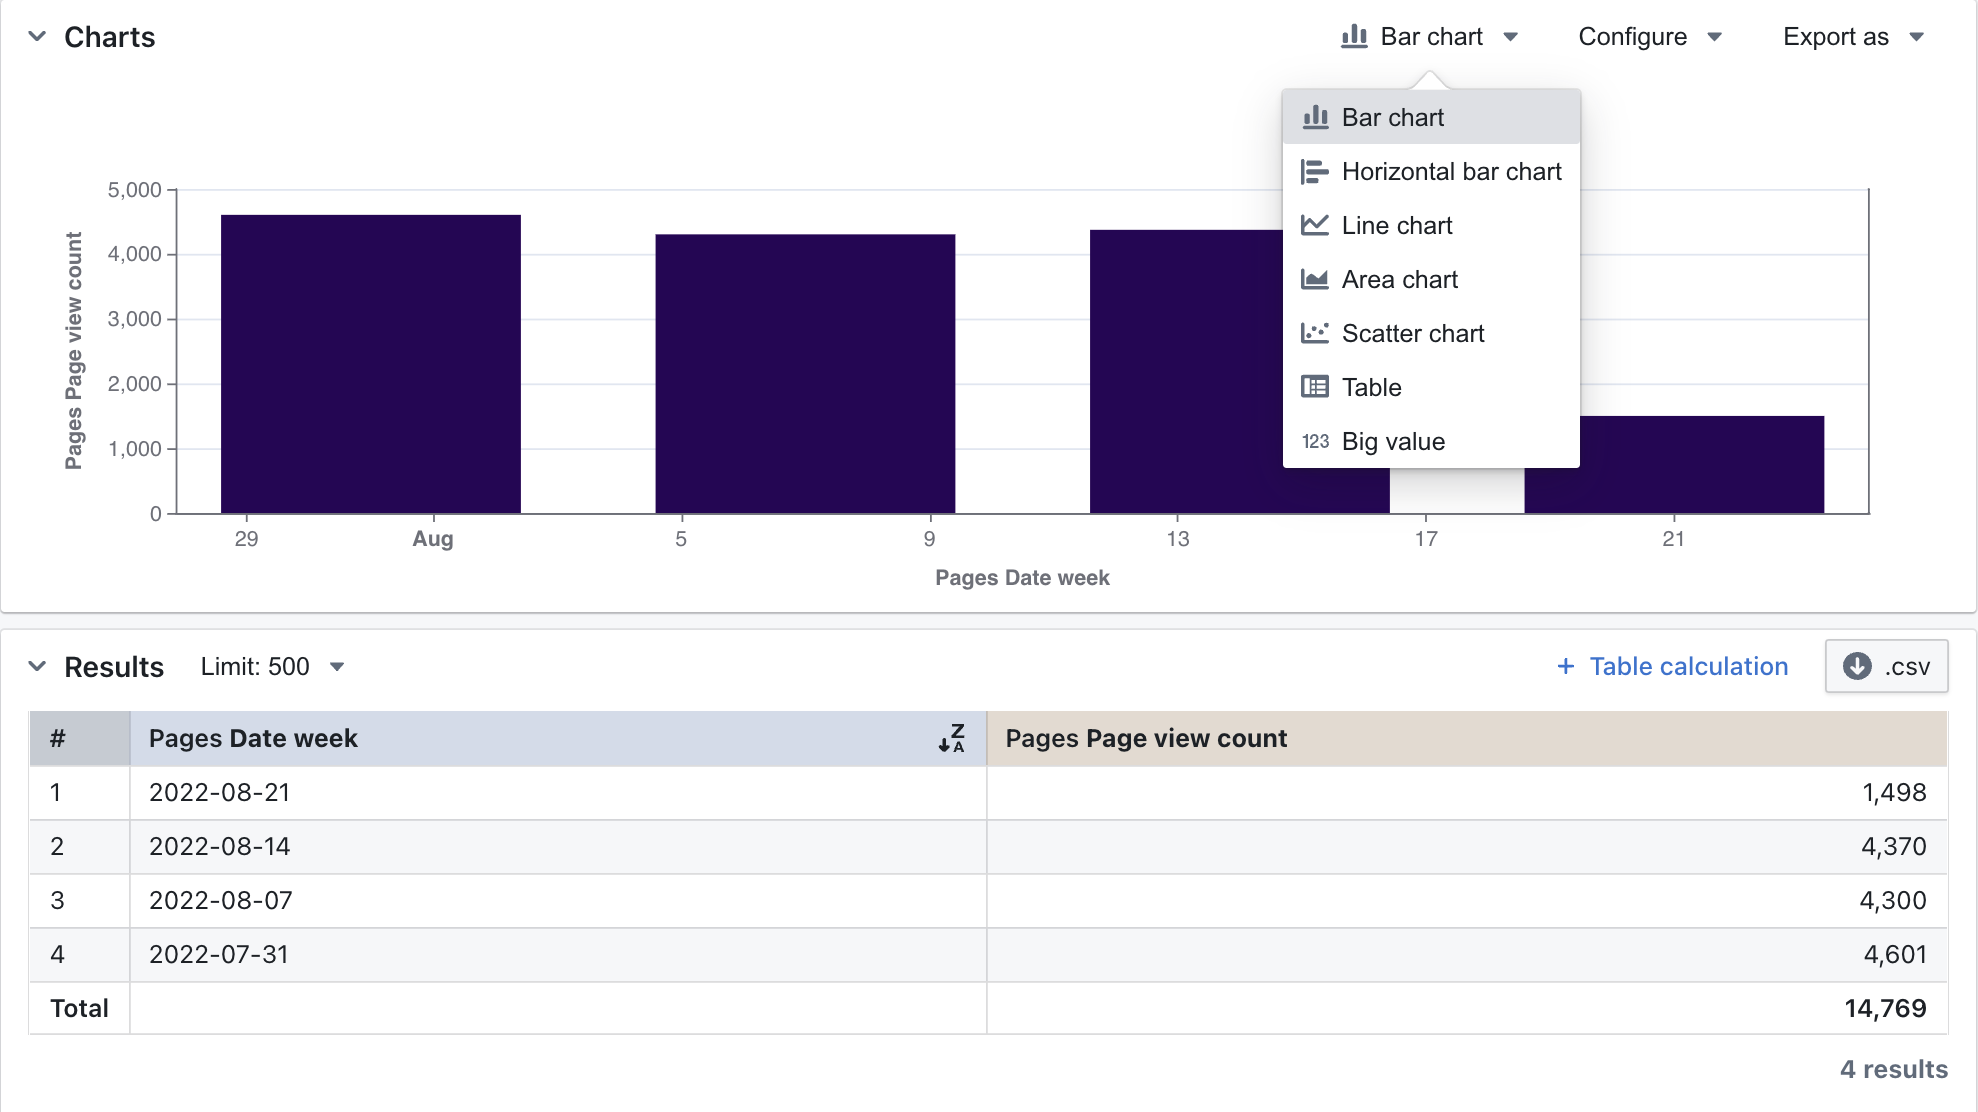
Once the query executes, the results will show in the results table. You can then open the charts section and choose a chart type to visualise the metric.
You can read more about [configuring your charts here](/references/chart-types).
### Step 4: Visualize query results as a chart
Once the query executes, the results will show in the results table. You can then open the charts section and choose a chart type to visualise the metric.
You can read more about [configuring your charts here](/references/chart-types).
 ### Step 5: Save your chart
Saved Charts allow you to save a specific chart or visualisation so you can share it or revisit it again in future.
When you open a saved chart, it will always update to display the latest data in your database
### Step 5: Save your chart
Saved Charts allow you to save a specific chart or visualisation so you can share it or revisit it again in future.
When you open a saved chart, it will always update to display the latest data in your database
 To save a chart:
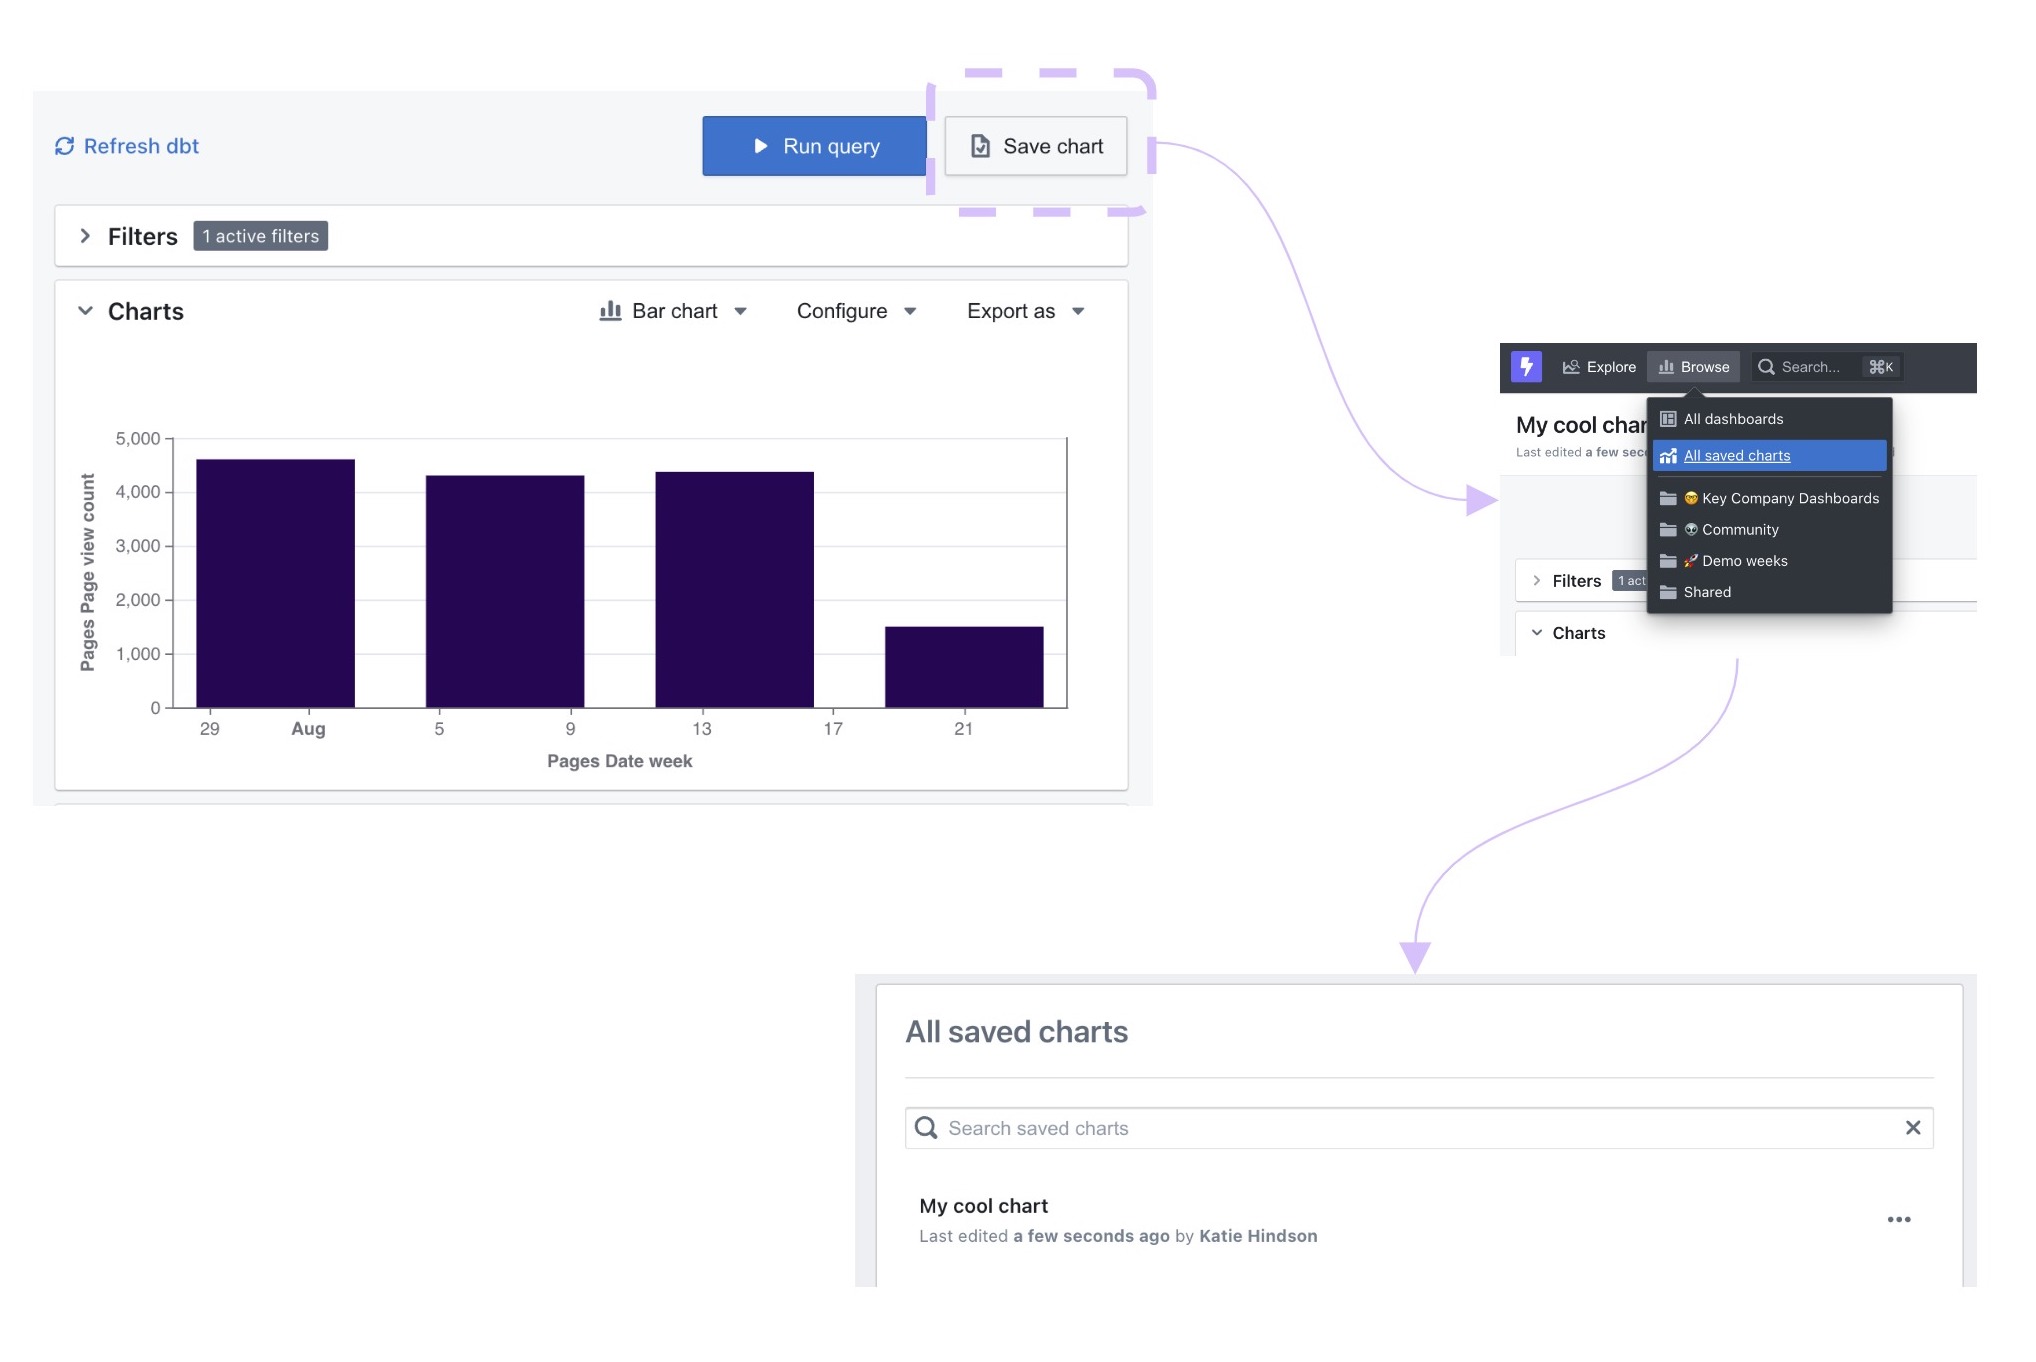
1. In chart panel of the Explore view you will find the button to save your chart.
2. Enter a memorable name for the chart, a good idea is to use a question as the name "How many orders are there at each stage?"
3. Click on `Saved charts` to see your finished work of art
To save a chart:
1. In chart panel of the Explore view you will find the button to save your chart.
2. Enter a memorable name for the chart, a good idea is to use a question as the name "How many orders are there at each stage?"
3. Click on `Saved charts` to see your finished work of art